Execution History
Execution History
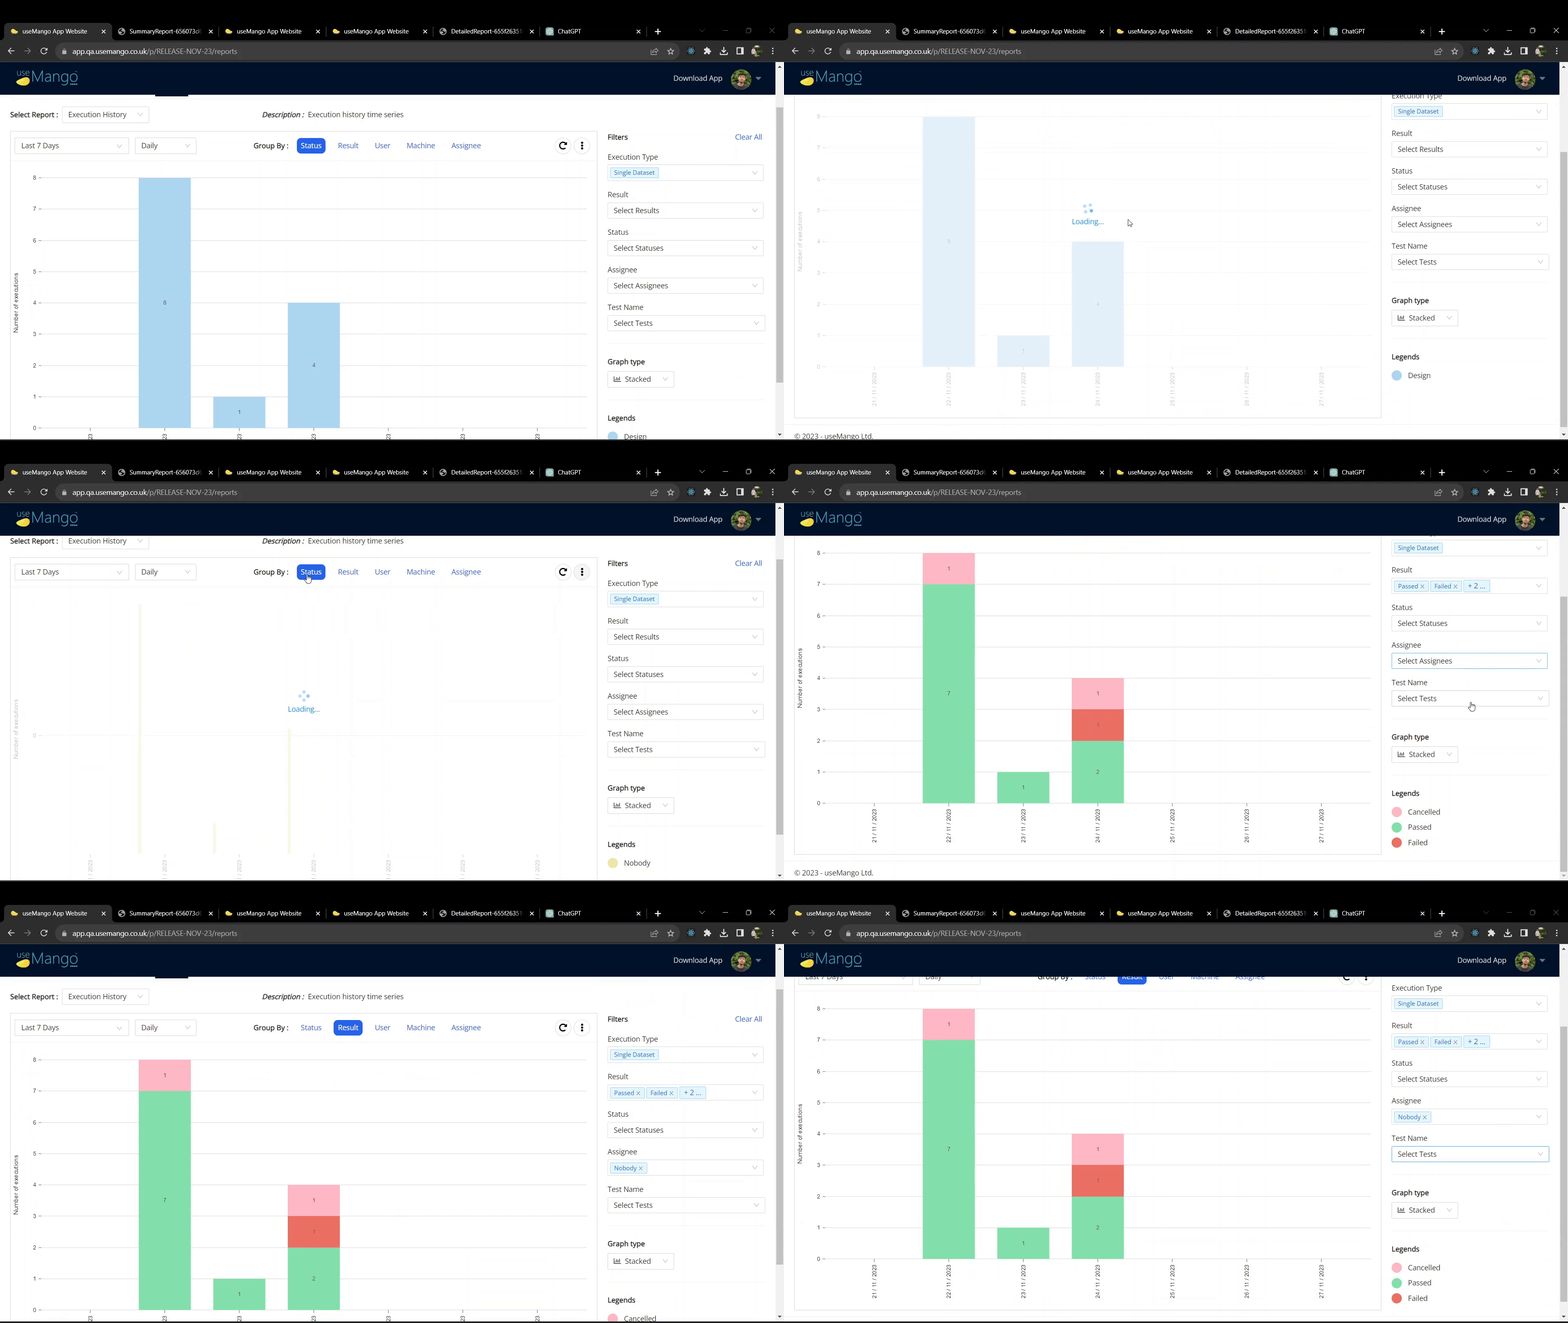
Access the execution history report by navigating to the “Reports” tab. This shows you the execution count report which displays the count of the executions over the specified date range.
The graph’s bins can be monthly, weekly, daily or hourly executions.
The graph can be grouped by Status, Result, User, Machine and Assignee.
It can also be filtered by Execution Type, Result, Status, Assignee and Test Name.

The X axis represent the time interval and the Y axis represents the execution count.
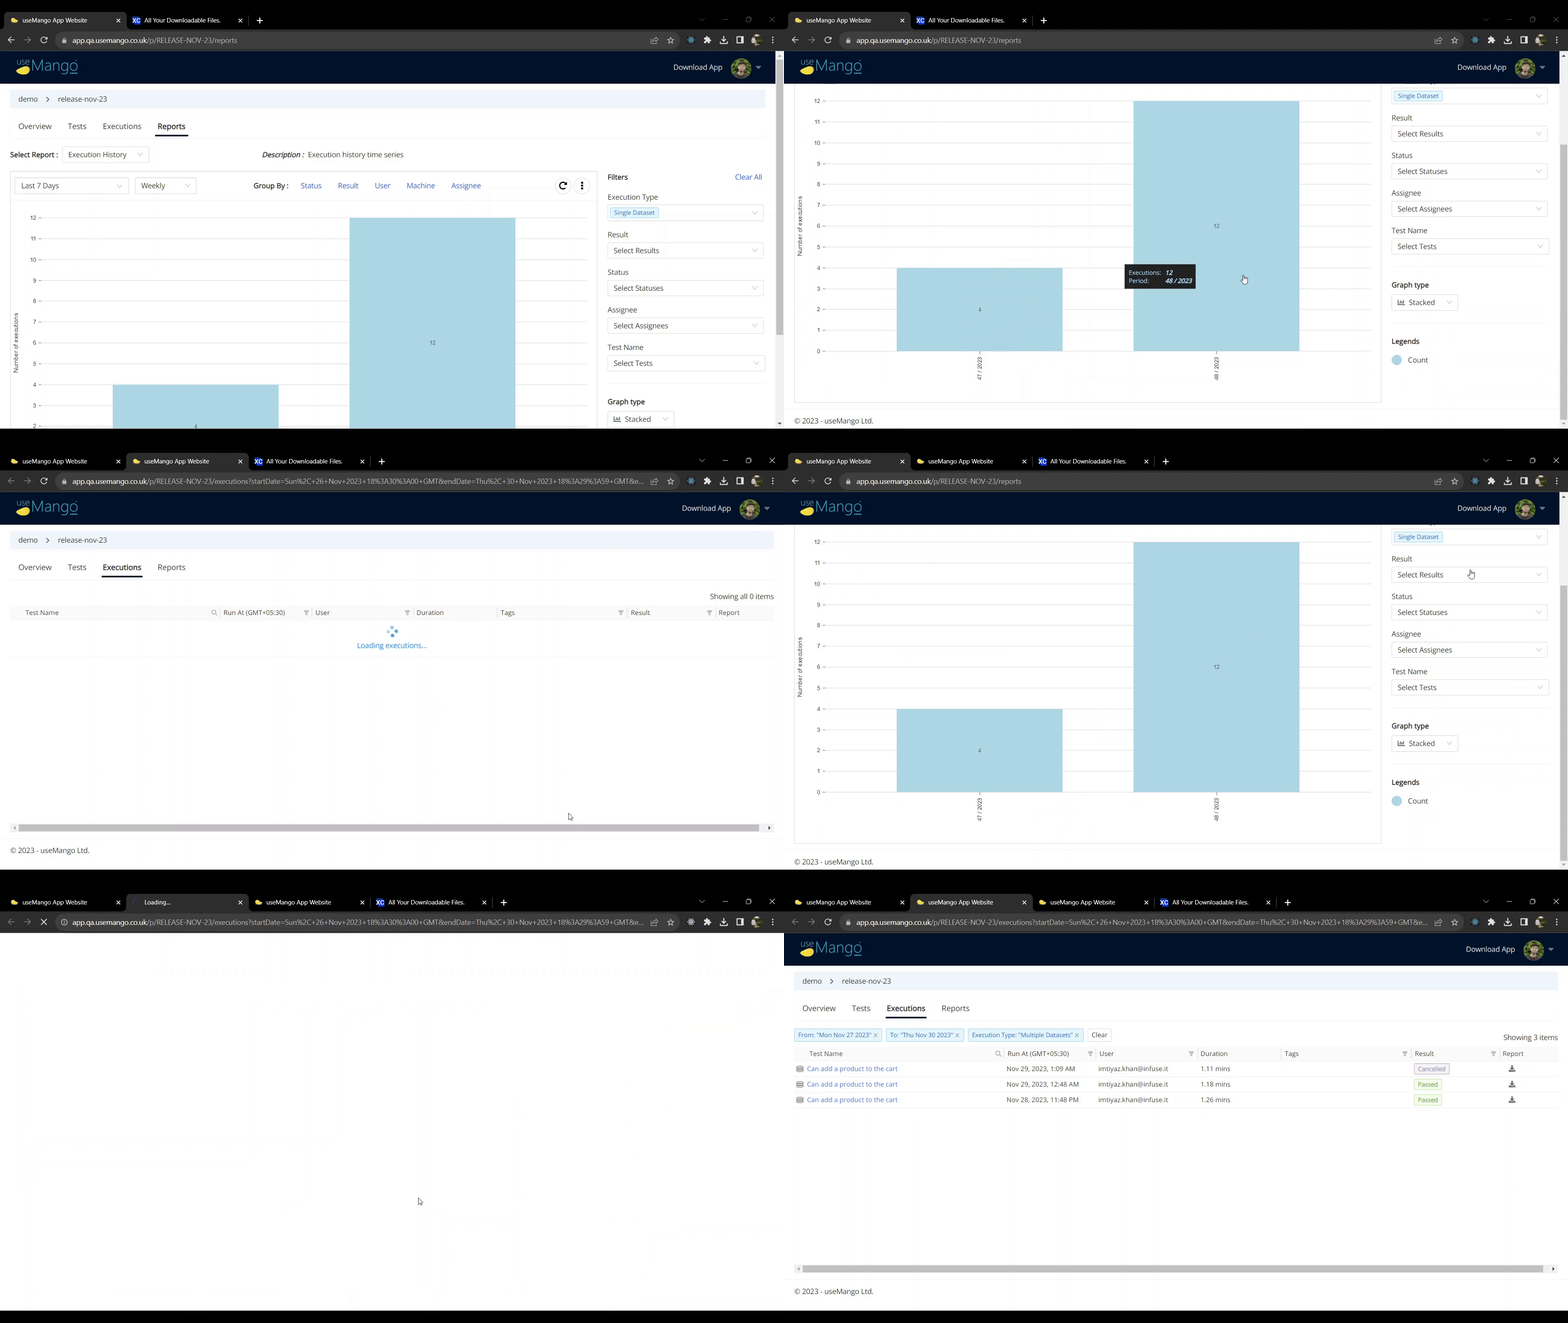
In this report, we can’t display executions involving multiple datasets and single test executions together as they don’t mean the same thing. Therefore, an “Execution Type” filter is provided. By default “Single Dataset” filter is set that displays single dataset executions i.e. execution with no datasets, single dataset and also executions that were part of an execution containing multiple datasets.
If you wish to see the executions with multiple datasets, select “Multiple Datasets” from the Execution Type filter.
Clicking on the bar in the report directs you to the executions’ list which displays the executions based on the filters that were applied.

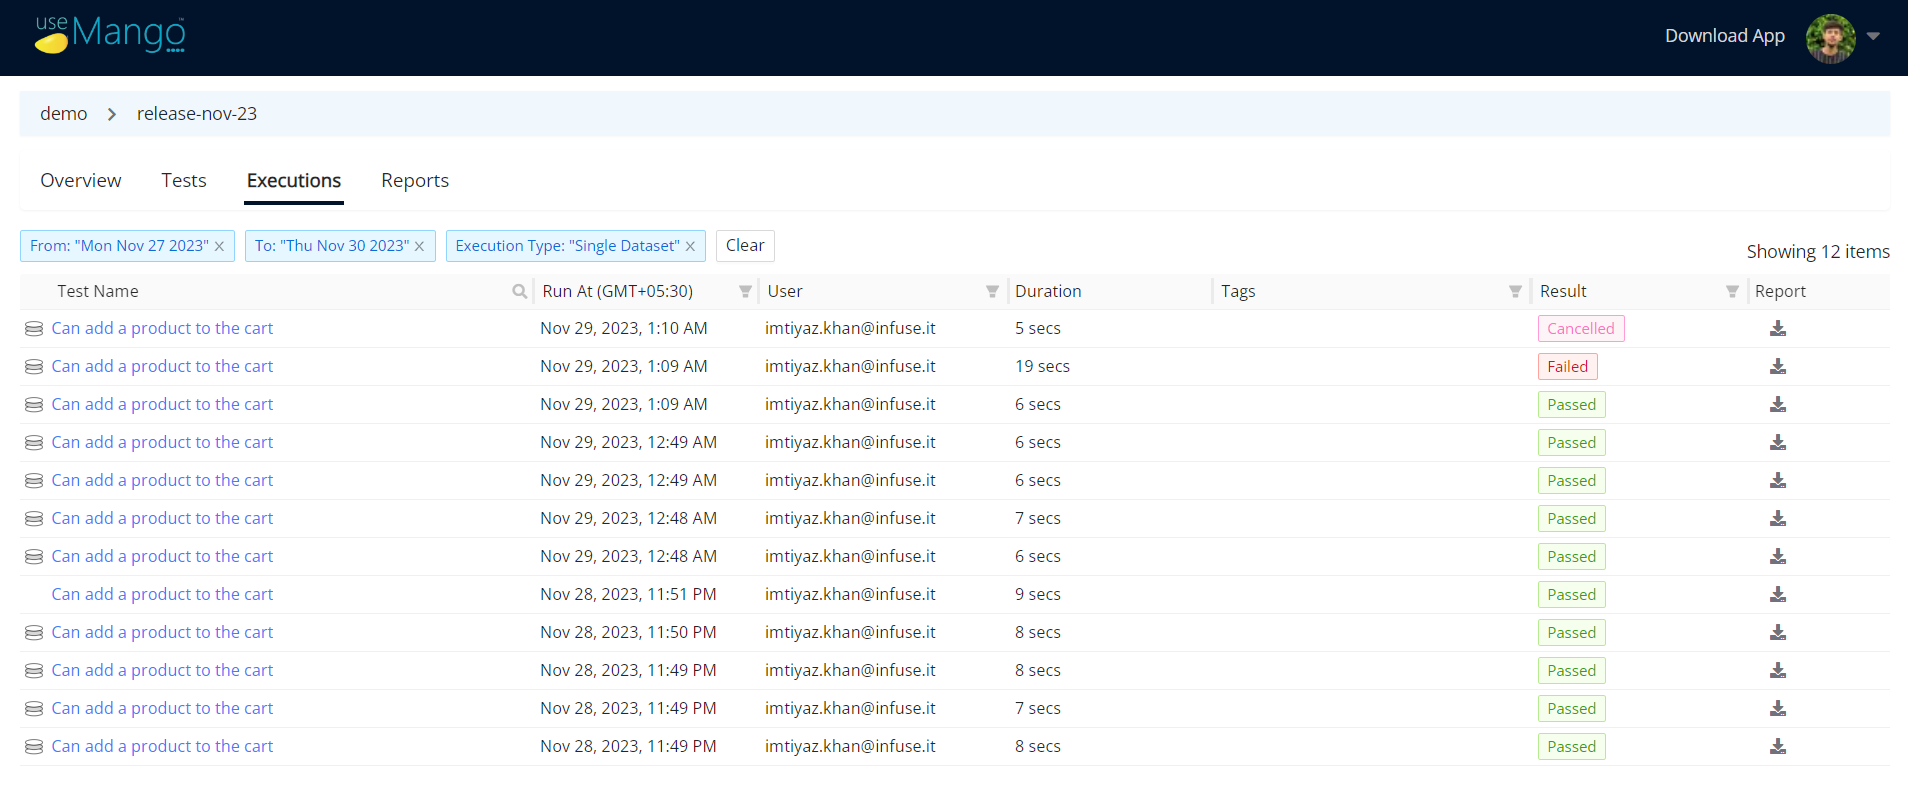
Below is the executions list when the Execution Type filter is set as “Single Dataset” on the reports page. Executions listed without an icon denote standalone runs on single datasets, while those marked with partially filled stacked disc icons represent single dataset executions which were part of multiple dataset execution.

Below is the executions list when the Execution Type filter is set as “Multiple Datasets”. The executions that represent multiple dataset runs are represented by a filled stack disc icon.

By clicking on the three vertical dots on the upper right of the graph, you can print the report or download it as an image or PDF.