Execution Time
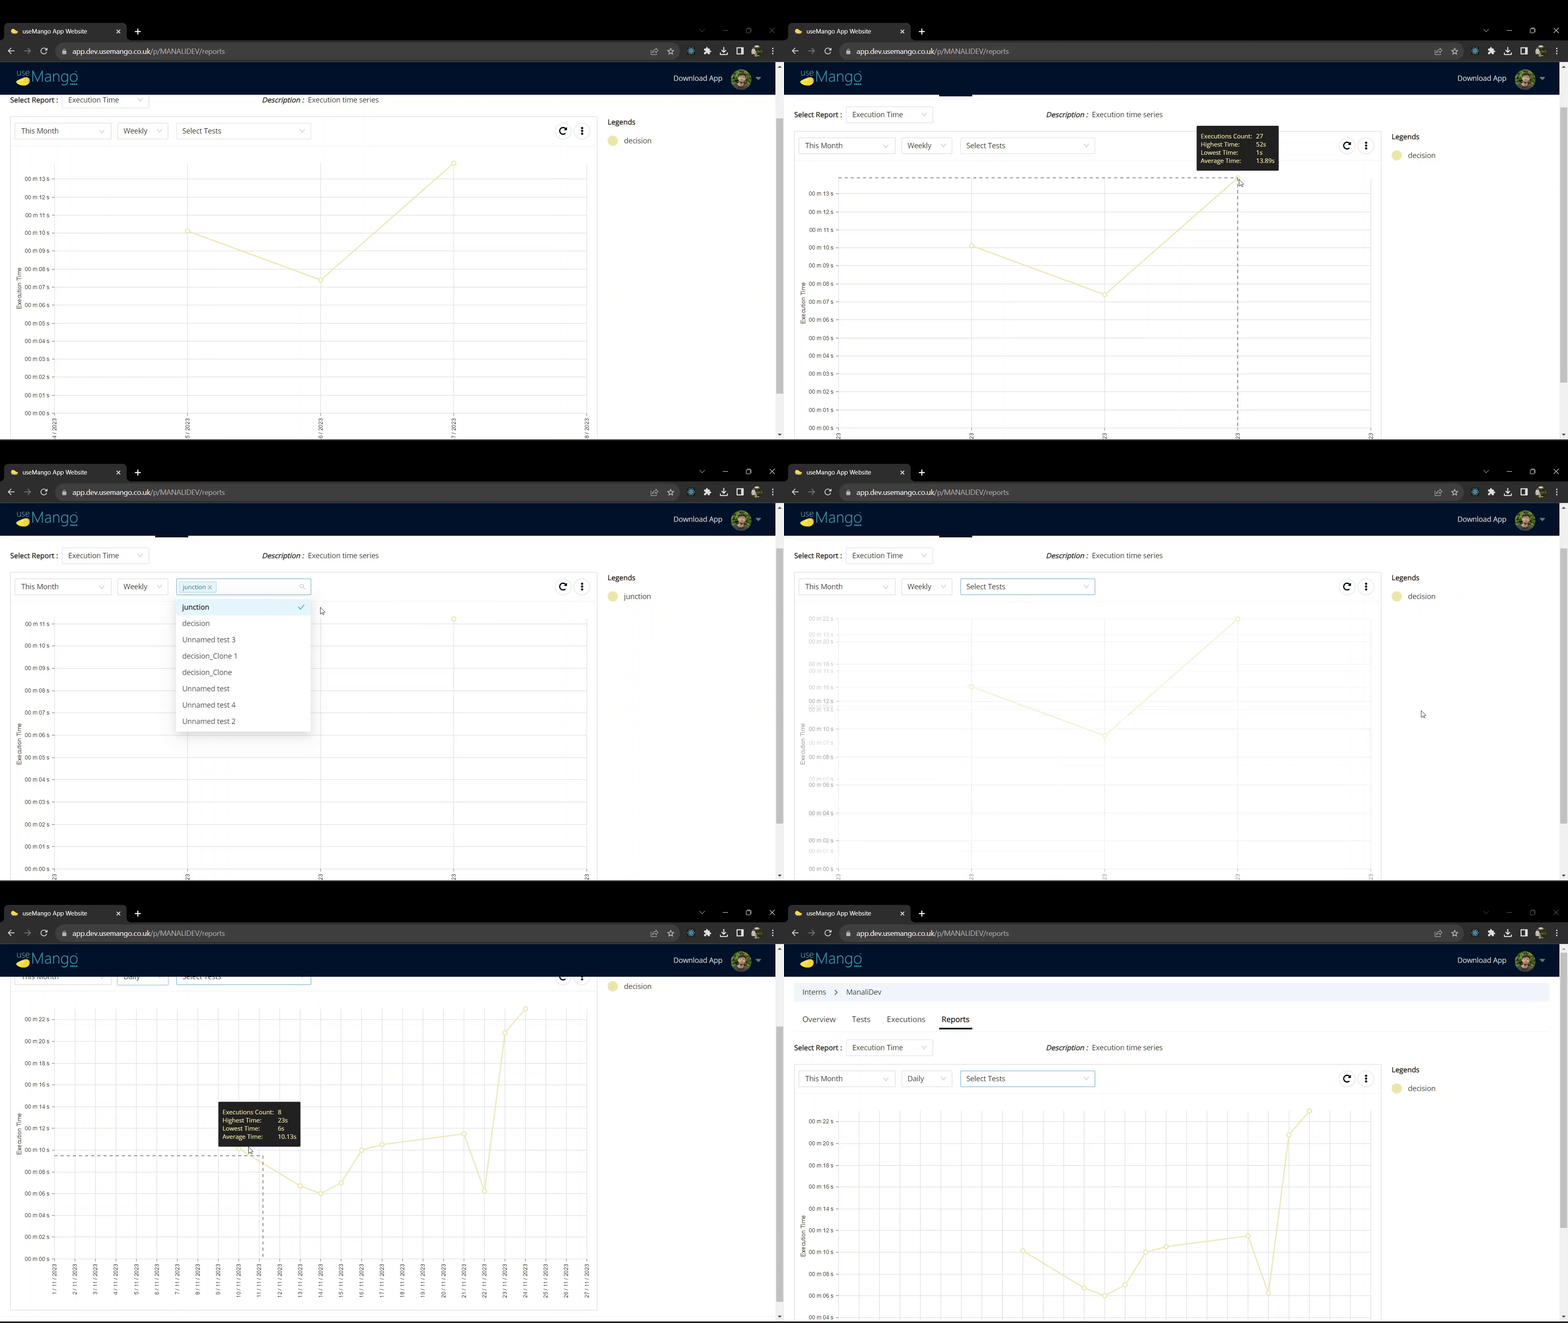
To view the Execution Time report select the “Execution time” from the select report dropdown on the “Reports” tab.
This report displays the time taken by a test on single dataset over a specfied time period.

Each data point is plotted using the average execution time for each time interaval and connected by a line that visually shows the execution time taken by the test on single dataset to execute over time.
Recently executed tests are shown by default on the graph. You can select test of your choice for the execution time comparison from the “Select Tests” dropdown.
The X axis represent the time interval and the Y axis represents the average execution time.
This report will only work on single dataset executions, encompassing execution with no datasets, single dataset and executions that were part of a multi-dataset execution. However, we do not plot Execution time at the level of multi-dataset execution.
By clicking on the three vertical dots on the upper right of the graph, you can print the report or download it as an image or PDF.